Oceangroup
DesignCryptocurrency trading platform with professional tools

Task
I was approached by the investment company OceanGroup. They said they had professional traders in three time zones, worked with client portfolios starting at $200, but people didn't trust them. They wanted to see complete transparency in transactions and understand where the money was going. Competitors offer attractive figures, but we honestly show both profits and losses.
Solution
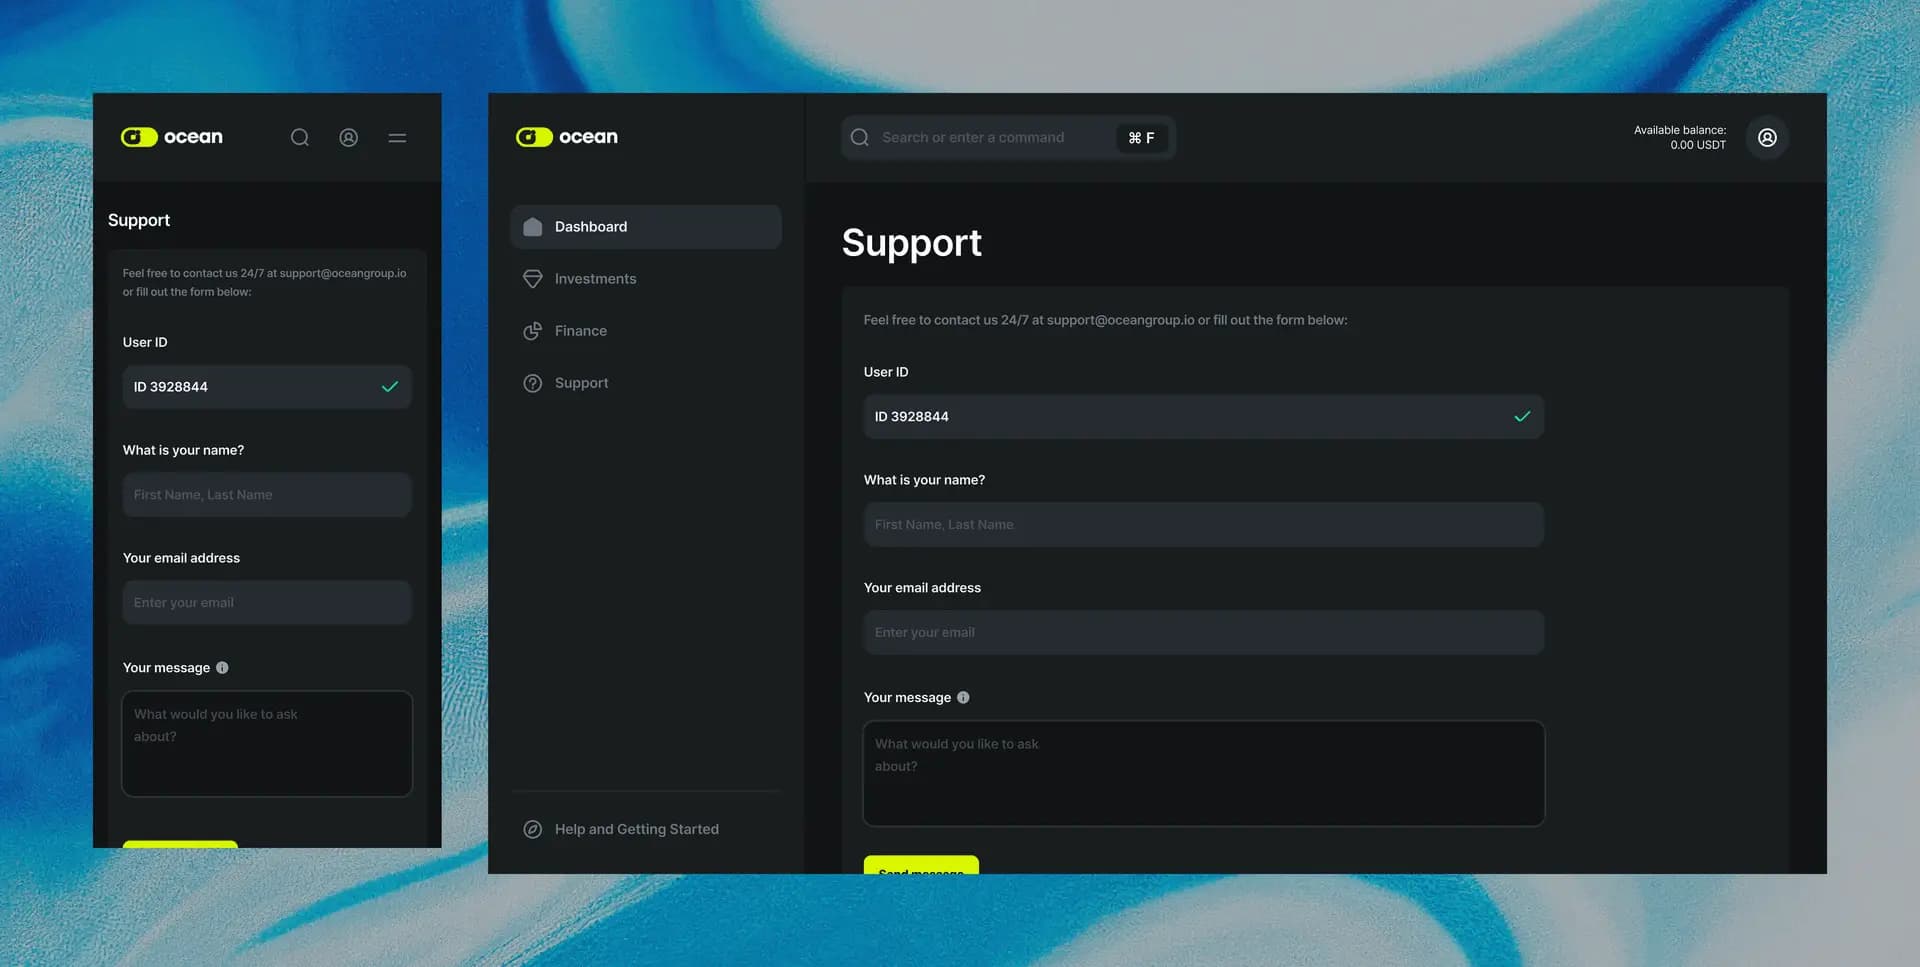
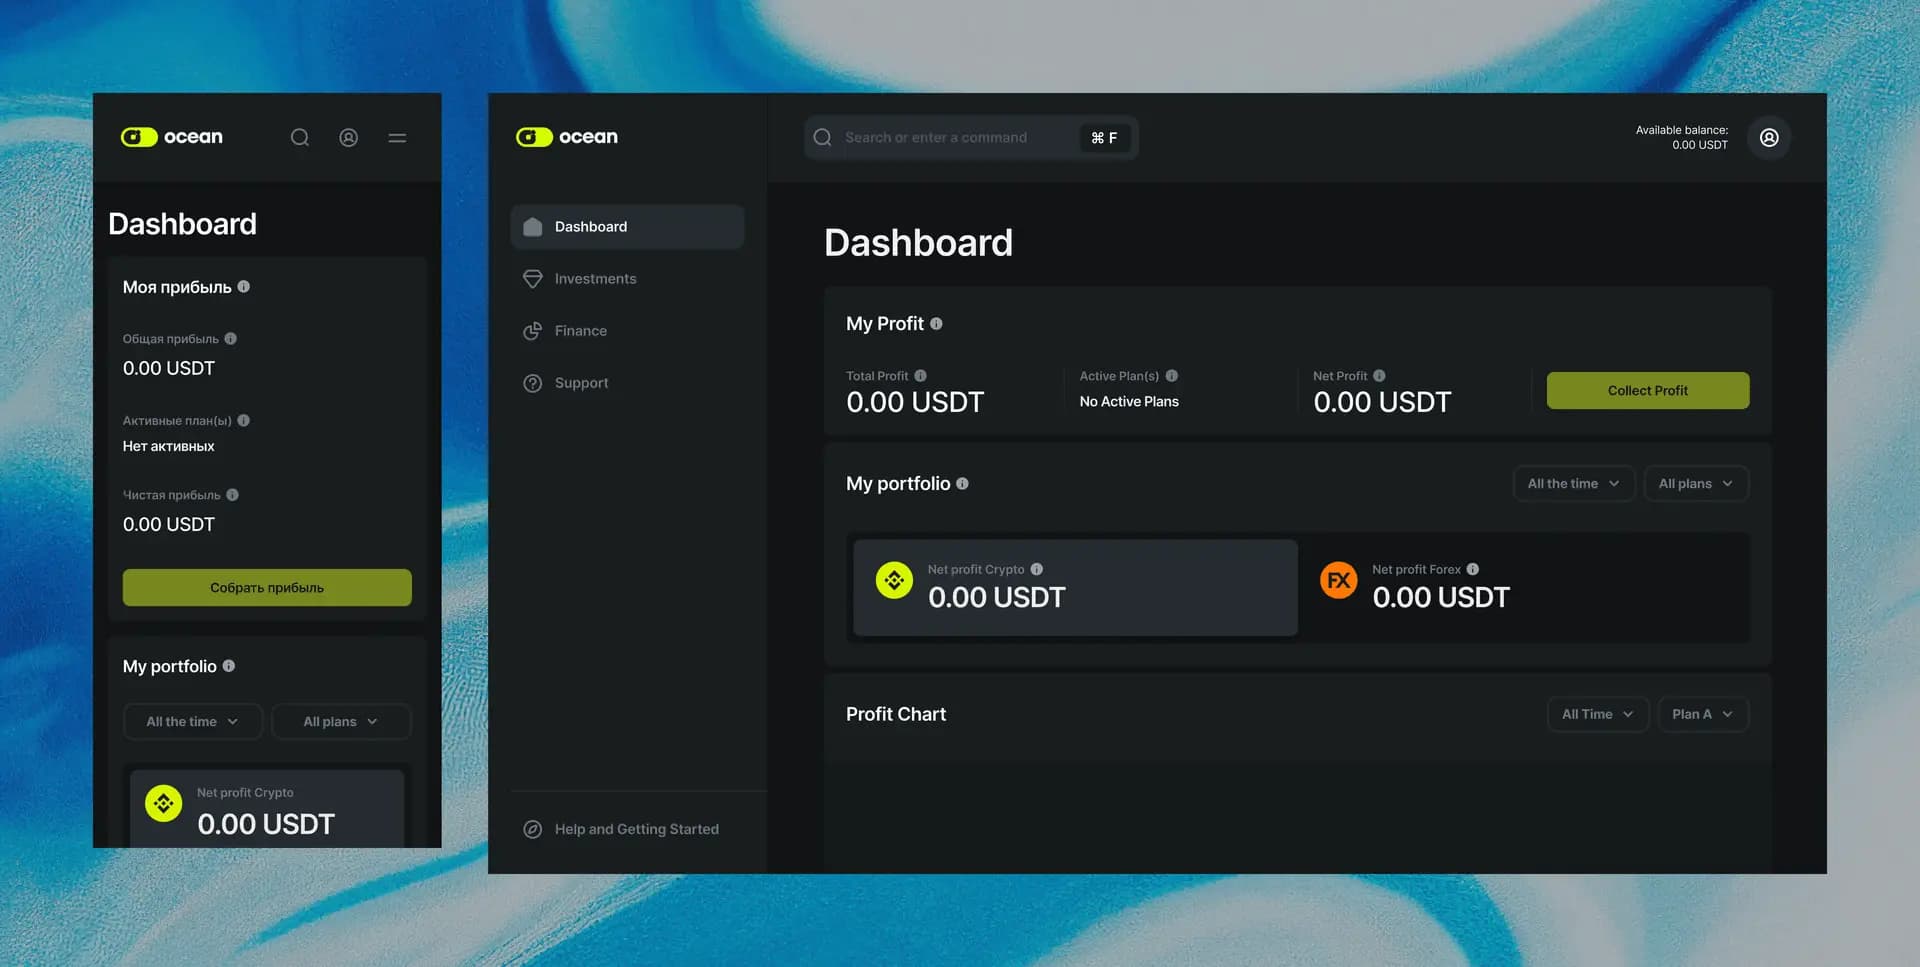
I designed a personal investor account with complete transparency. I created a dashboard that shows statistics for all transactions since the company's first day of operation — both successful and loss-making. Added detailed reporting for each closed position.
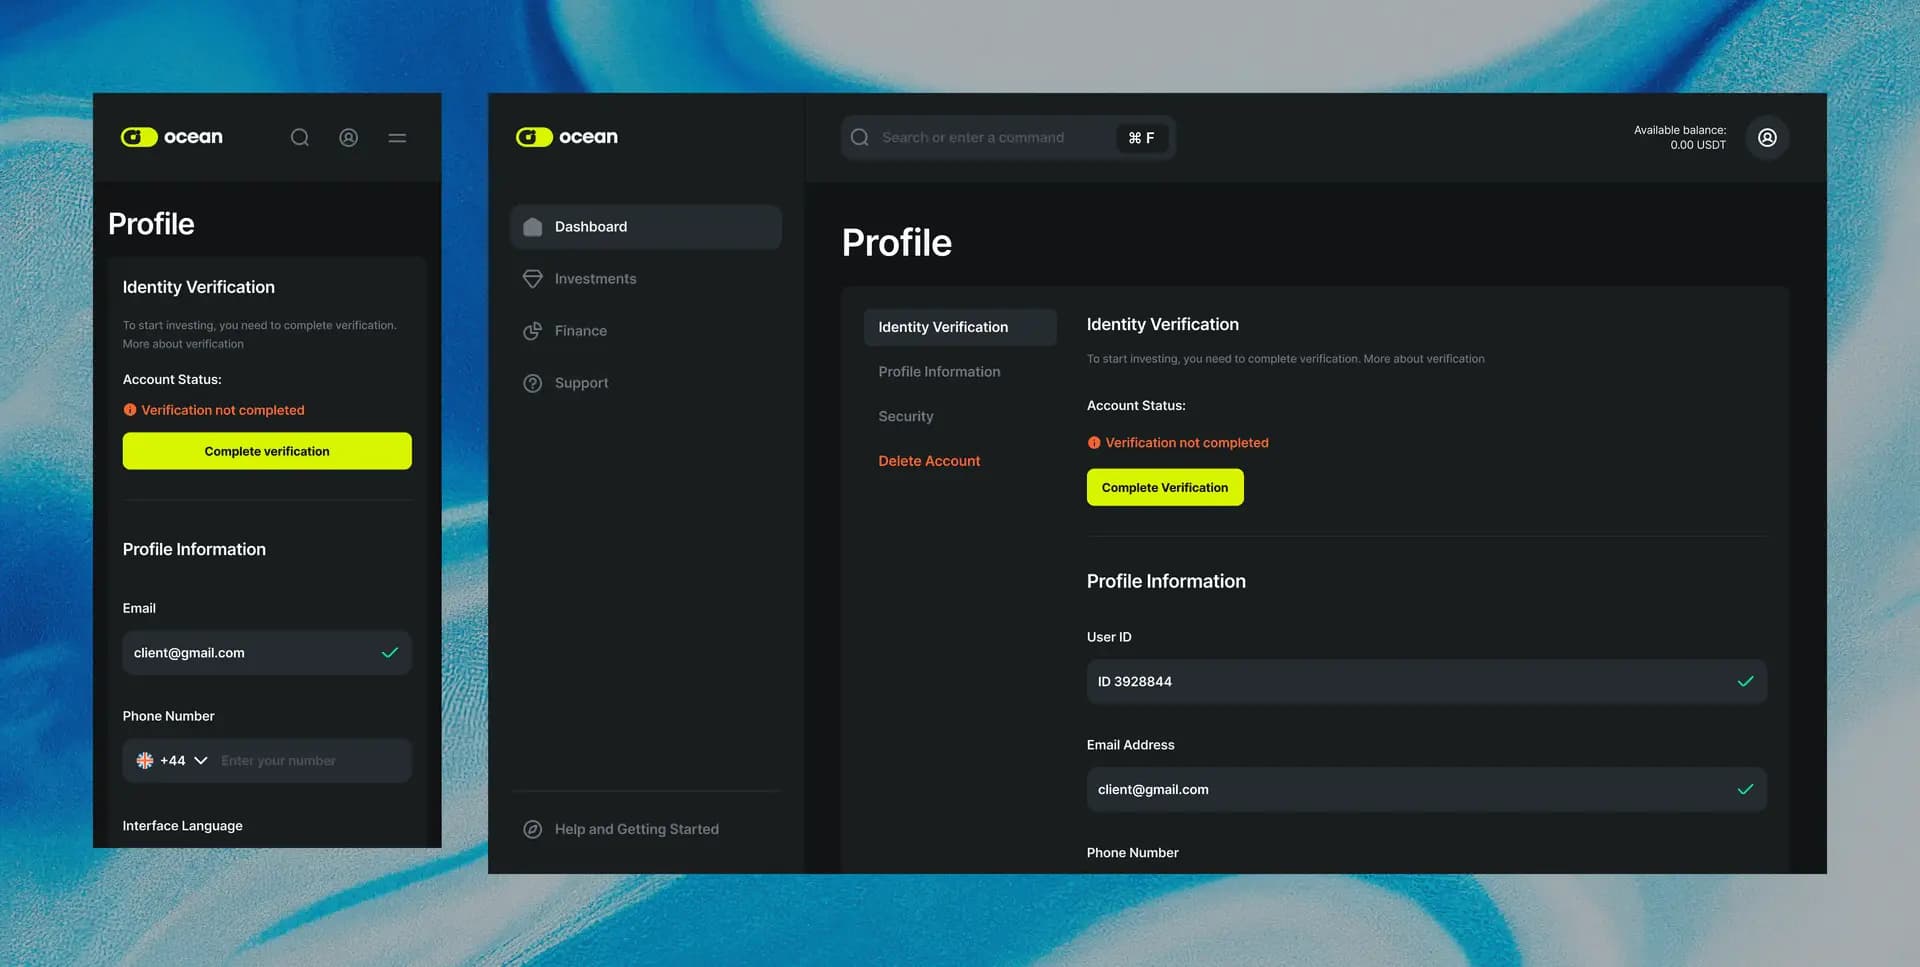
Created a clear onboarding process: registration → verification → account replenishment → transfer to management. All stages with progress indicators.
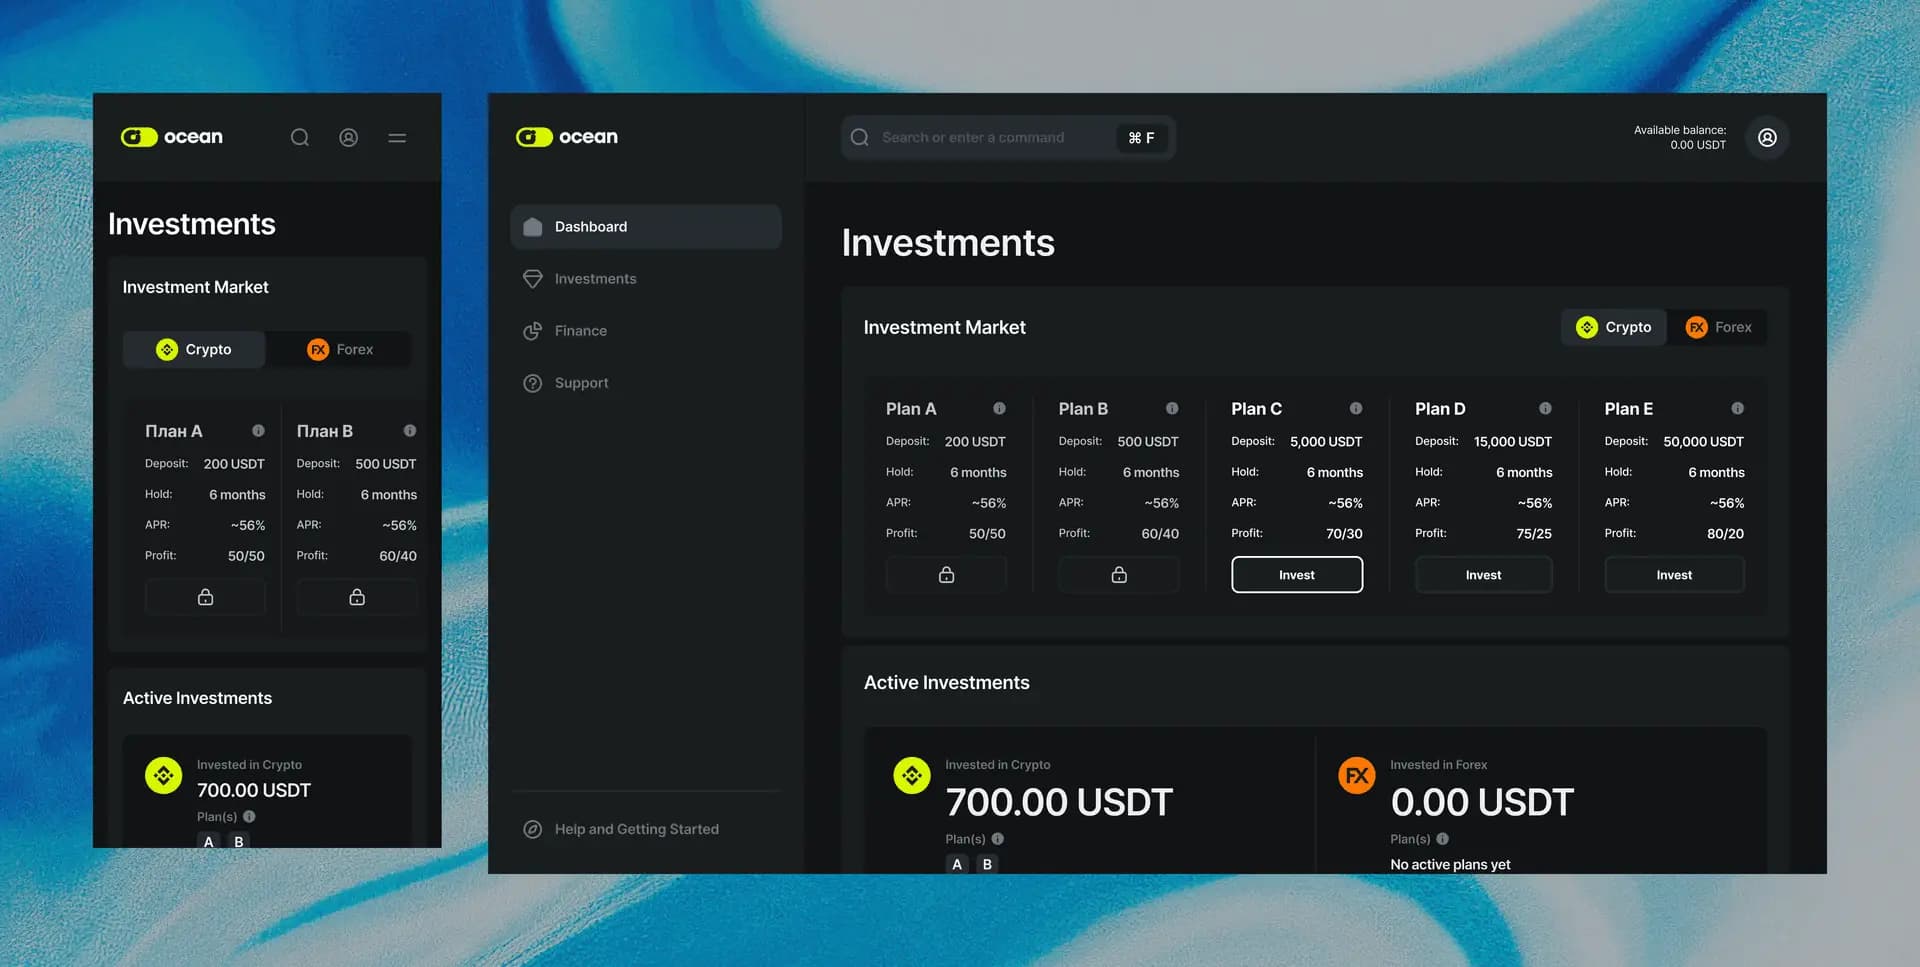
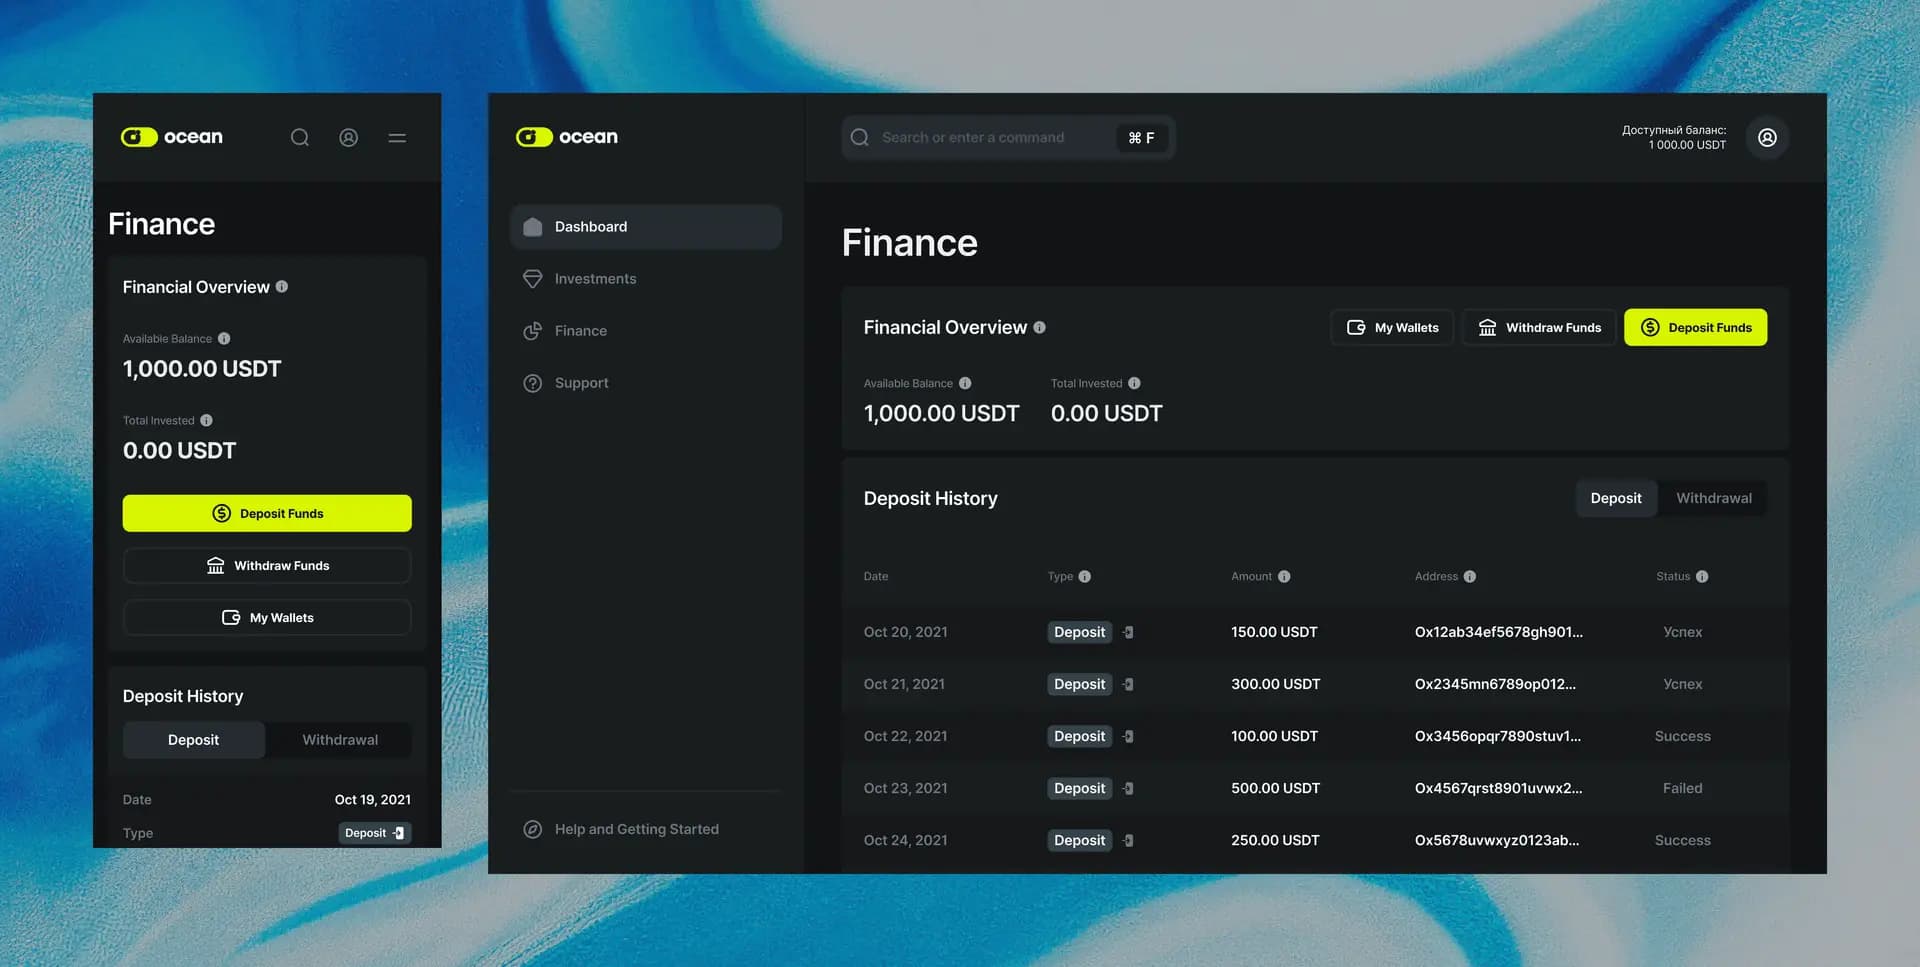
I developed an interface for quick deposits/withdrawals to the Tether wallet. I created a section with open statistics on profitability and risks. I paid special attention to data visualization — the graphs are understandable even to beginners in investing.
Result
Customers began to complete full registration much more often thanks to transparency. The time it takes to make an investment decision has been reduced — people can see real trading statistics. The company has gained the trust of investors thanks to the honest visualization of both profits and losses.